prometheus+grafana应用监控配置
创始人
2025-01-09 13:36:14
0次
配置Prometheus
官方地址:Download | Prometheus
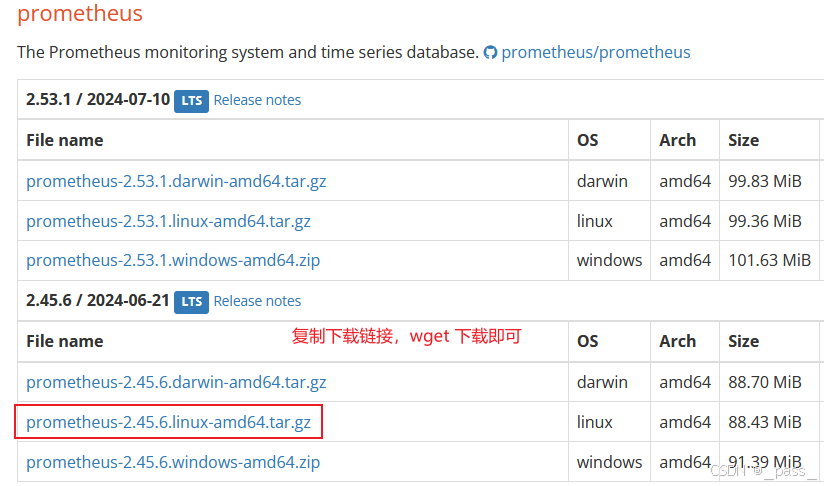
(wegt下载压缩包,解压并重命名prometheus,文件放于/data/prometheus即可)
配置 service方法(文件放于 /etc/systemd/system/prometheus.service):
[Unit] Description=Prometheus Server Documentation=https://prometheus.io/docs/introduction/overview/ After=network-online.target [Service] Type=simple User=prometheus Group=prometheus ExecStart=/data/prometheus/prometheus/prometheus \ --config.file=/data/prometheus/prometheus/prometheus.yml \ --storage.tsdb.path=/data/prometheus/prometheus/data \ --storage.tsdb.retention.time=60d \ --web.enable-lifecycle Restart=on-failure [Install] WantedBy=multi-user.target 授权给用户 prometheus
# 创建用户 -M 不创建源目录 -s 指定 shell useradd -M -s /usr/sbin/nologin prometheus # 赋权 chown prometheus:prometheus -R /data/prometheus启动运行并检查状态
# 启动 systemctl start prometheus.service # 检查 systemctl status prometheus.service # 开启自启动 systemctl enable prometheus.service # 修改单元文件,重新加载systemd配置 sudo systemctl daemon-reload # 检查日志方法 journalctl -u prometheus.service -f重新加载 prometheus
# -X 指定 POST 请求 curl -X POST http://localhost:9090/-/reload 访问web地址9090:
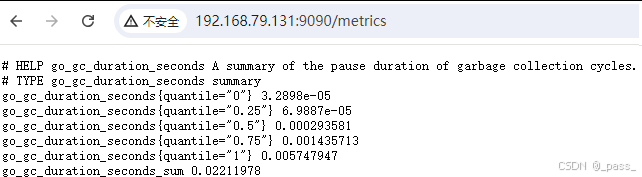
# ip:9090 访问 prometheus http://xxx.xxx.xxx.xxx:9090 监控指标 http://xxx.xxx.xxx.xxx:9090/metrics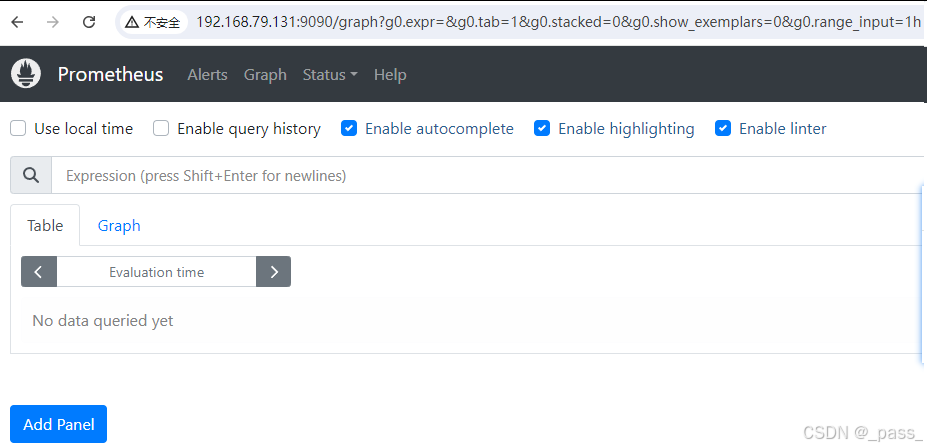
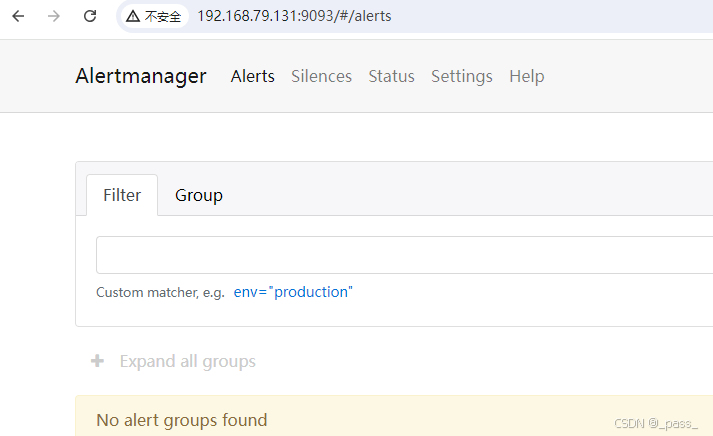
配置 alertmanager
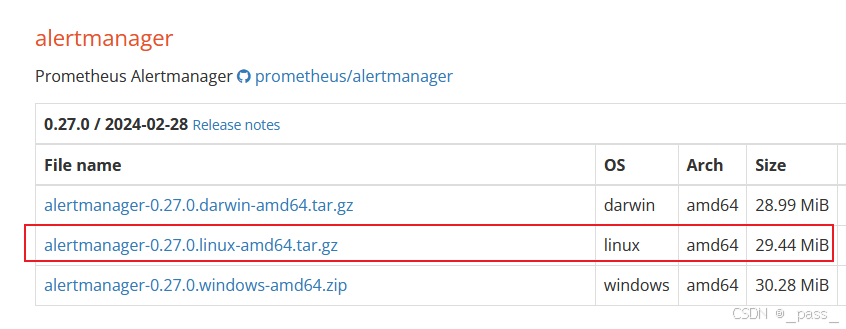
配置文件
[Unit] Description=Alert Manager Wants=network-online.target After=network-online.target [Service] Type=simple User=prometheus Group=prometheus ExecStart=/data/prometheus/alertmanager/alertmanager \ --config.file=/data/prometheus/alertmanager/alertmanager.yml \ --storage.path=/data/prometheus/prometheus/data \ Restart=always [Install] WantedBy=multi-user.target访问:web端口9093
配置alert服务器告警提示:
root@pass:~# cat /data/prometheus/prometheus/alert.yml groups: - name: Prometheus alert rules: - alert: 服务告警 expr: up == 0 for: 30s labels: severity: critical annotations: instance: "{{ $labels.instance }}" description: "{{ $labels.job }} 服务器"访问web检查:
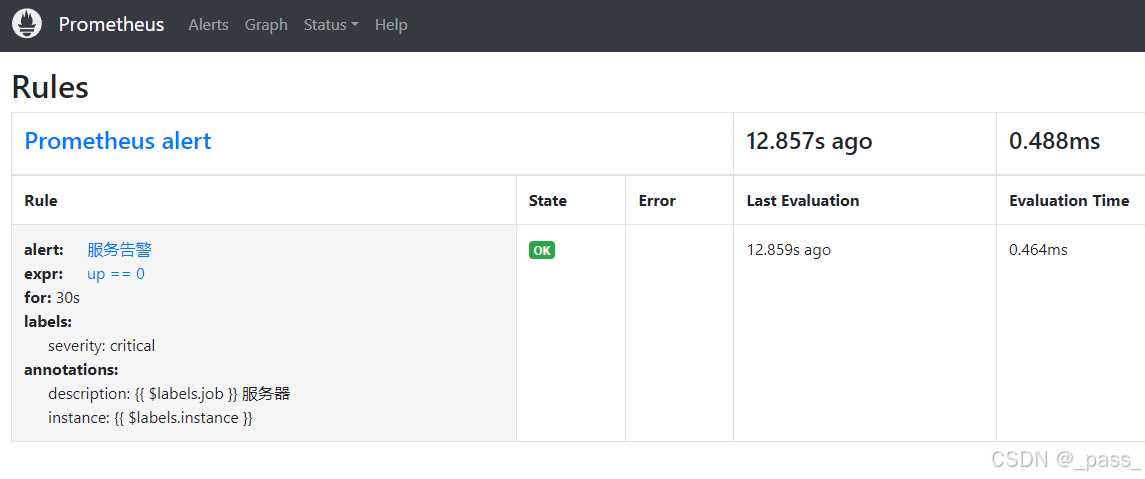
检查yml文件配置方法promtool工具:
root@pass:~# cd /data/prometheus/prometheus/ root@pass:/data/prometheus/prometheus# ./promtool check config prometheus.yml Checking prometheus.yml SUCCESS: 1 rule files found SUCCESS: prometheus.yml is valid prometheus config file syntax Checking alert.yml SUCCESS: 1 rules found配置grafana
下载地址:Download Grafana | Grafana Labs
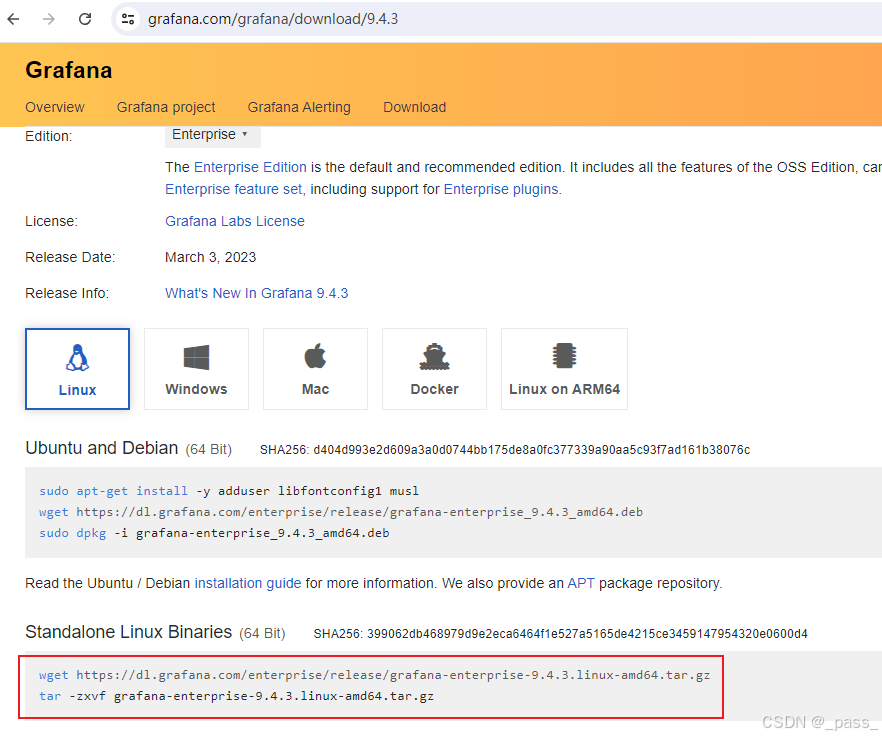
配置service文件:
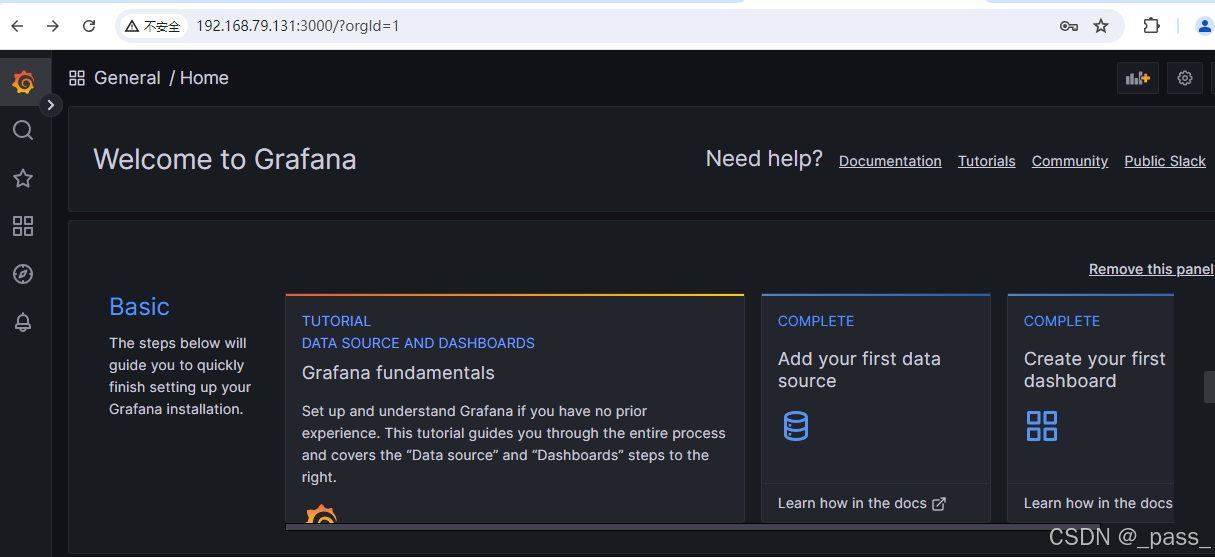
[Unit] Description=Grafana server Documentation=http://docs.grafana.org [Service] Type=simple User=prometheus Group=prometheus Restart=on-failure ExecStart= /data/prometheus/grafana/bin/grafana-server \ --config=/data/prometheus/grafana/conf/defaults.ini \ --homepath=/data/prometheus/grafana [Install] WantedBy=multi-user.target 访问web端口3000:(默认账号及密码admin/admin)
配置node_exporter
下载地址同Prometheus
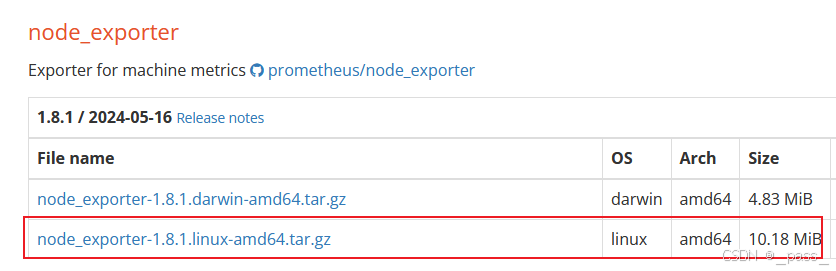
配置service文件:
[Unit] Description=node_exporter Documentation=http://prometheus.io/ After=network.target [Service] User=prometheus Group=prometheus Restart=on-failure ExecStart= /data/prometheus/node_exporter/node_exporter [Install] WantedBy=multi-user.target 访问web端口9100

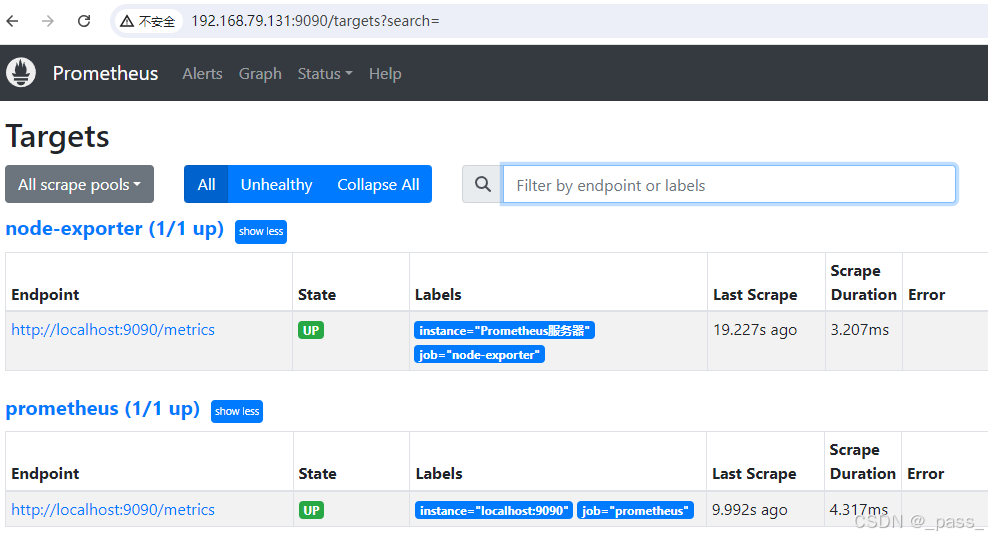
最后注意记得配置时将需要的配置到Prometheus.yml中:
# my global config global: scrape_interval: 15s # Set the scrape interval to every 15 seconds. Default is every 1 minute. evaluation_interval: 15s # Evaluate rules every 15 seconds. The default is every 1 minute. # scrape_timeout is set to the global default (10s). # Alertmanager configuration alerting: alertmanagers: - static_configs: - targets: - localhost:9093 # - alertmanager:9093 # Load rules once and periodically evaluate them according to the global 'evaluation_interval'. rule_files: - "alert.yml" # - "first_rules.yml" # - "second_rules.yml" # A scrape configuration containing exactly one endpoint to scrape: # Here it's Prometheus itself. scrape_configs: # The job name is added as a label `job=` to any timeseries scraped from this config. - job_name: "prometheus" # metrics_path defaults to '/metrics' # scheme defaults to 'http'. static_configs: - targets: ["localhost:9090"] - job_name: "node-exporter" scrape_interval: 15s # metrics_path defaults to '/metrics' # scheme defaults to 'http'. static_configs: - targets: ["localhost:9090"] labels: instance: Prometheus服务器 web页面展示
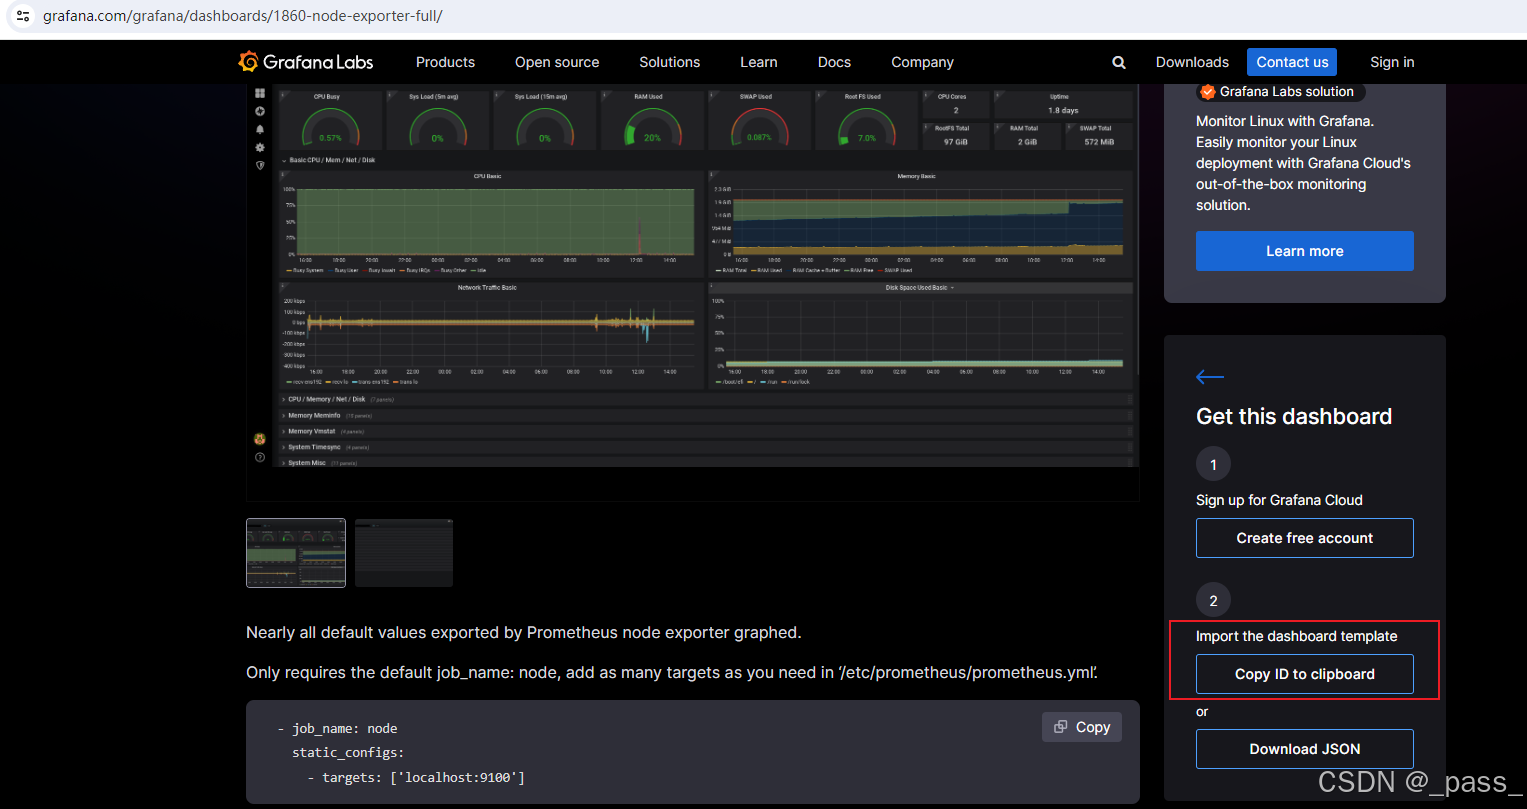
手动创建仪表板:官方地址 Grafana dashboards | Grafana Labs
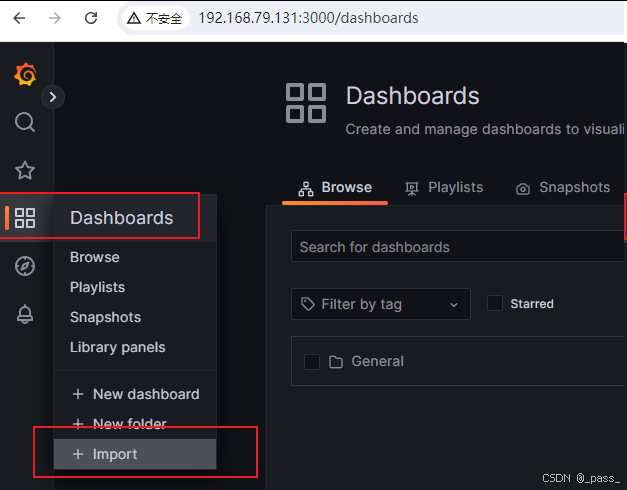
复制需要的ID ,然后导入到granafa图表中即可
第一步:
第二步:
第三步:
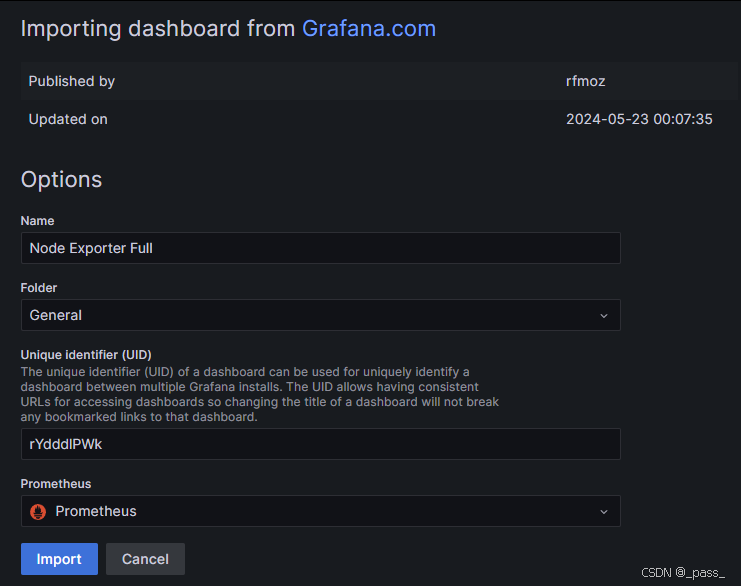
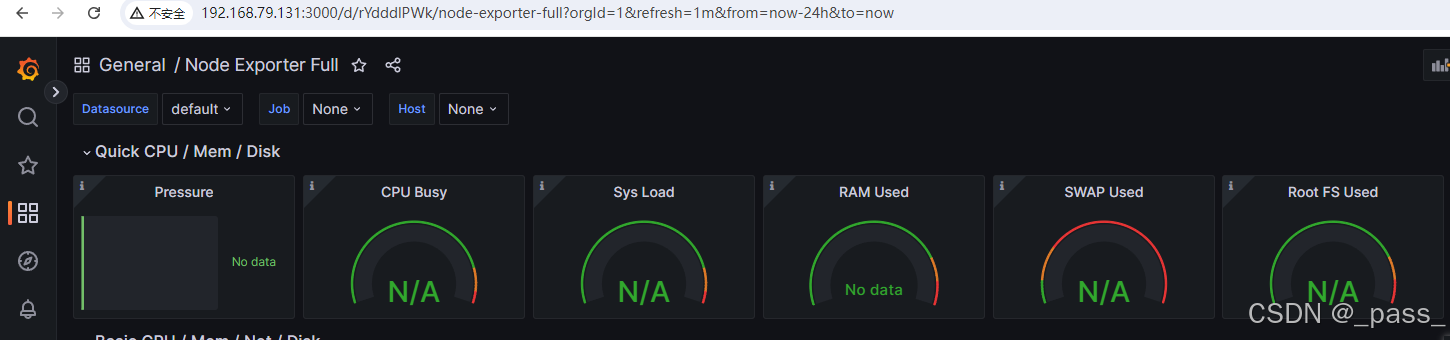
展示结果:
相关内容
热门资讯
绝活儿辅助!广西老友玩老是输怎...
绝活儿辅助!广西老友玩老是输怎么办(辅助挂)都是真的有辅助app(讲解有挂)在进入广西老友玩老是输怎...
法门辅助!福建13水插件(辅助...
法门辅助!福建13水插件(辅助挂)一贯是有辅助技巧(有挂技术)1、许多玩家不知道福建13水插件辅助怎...
办法辅助!潮友会app下载官方...
办法辅助!潮友会app下载官方辅助器(辅助挂)真是真的是有辅助app(有挂教程)该软件可以轻松地帮助...
妙招辅助!邯郸胡乐挂辅助(辅助...
妙招辅助!邯郸胡乐挂辅助(辅助挂)好像存在有辅助插件(有挂方略)1、上手简单,内置详细流程视频教学,...
教程书辅助!乐酷辅助(辅助挂)...
教程书辅助!乐酷辅助(辅助挂)其实存在有辅助脚本(有挂细节)乐酷辅助能透视中分为三种模型:乐酷辅助模...
学习辅助!决战卡五星辅助(辅助...
学习辅助!决战卡五星辅助(辅助挂)本来真的是有辅助软件(有人有挂)学习辅助!决战卡五星辅助(辅助挂)...
绝活辅助!边锋嘉兴麻将辅助器(...
绝活辅助!边锋嘉兴麻将辅助器(辅助挂)真是真的有辅助神器(新版有挂)1、边锋嘉兴麻将辅助器公共底牌简...
举措辅助!枫叶辅助器(辅助挂)...
举措辅助!枫叶辅助器(辅助挂)本来存在有辅助技巧(竟然有挂)1、下载好枫叶辅助器正确养号方法之后点击...
讲义辅助!点我达辅助(辅助挂)...
讲义辅助!点我达辅助(辅助挂)一直存在有辅助技巧(有人有挂)1、点我达辅助辅助器安装包、点我达辅助辅...
模块辅助!威信茶馆有挂的吗(辅...
模块辅助!威信茶馆有挂的吗(辅助挂)一直真的是有辅助脚本(揭秘有挂)1、玩家可以在威信茶馆有挂的吗线...